
What Is FFT Spectrum Analysis?
How Vibration Spectra Help Identify Equipment Faults
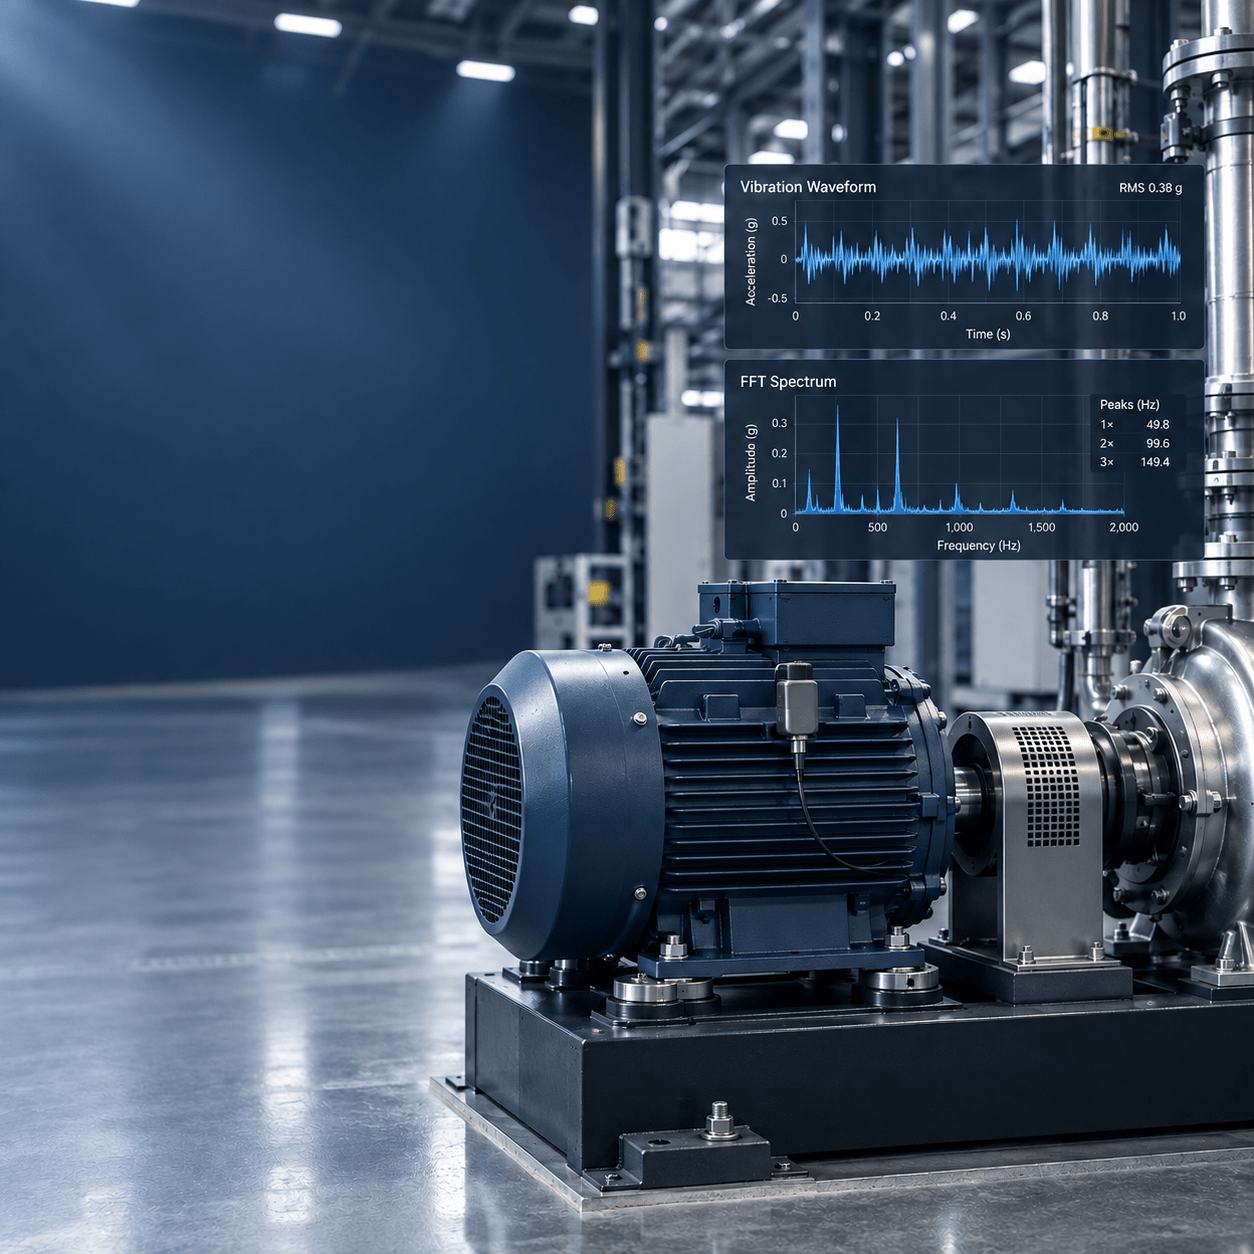
Vibration monitoring helps detect abnormal equipment behavior, while FFT spectrum analysis takes the next step by helping identify what may be causing the abnormal vibration.
Industrial machinery naturally generates vibration during operation.
With vibration sensors, we can collect vibration signals from operating equipment. However, simply knowing that “vibration has increased” does not necessarily tell us what is actually wrong with the machine.
This is where FFT spectrum analysis becomes valuable. By analyzing the frequency components within a vibration signal, FFT can reveal characteristic patterns that may be associated with specific equipment faults.
What Is FFT Spectrum Analysis?
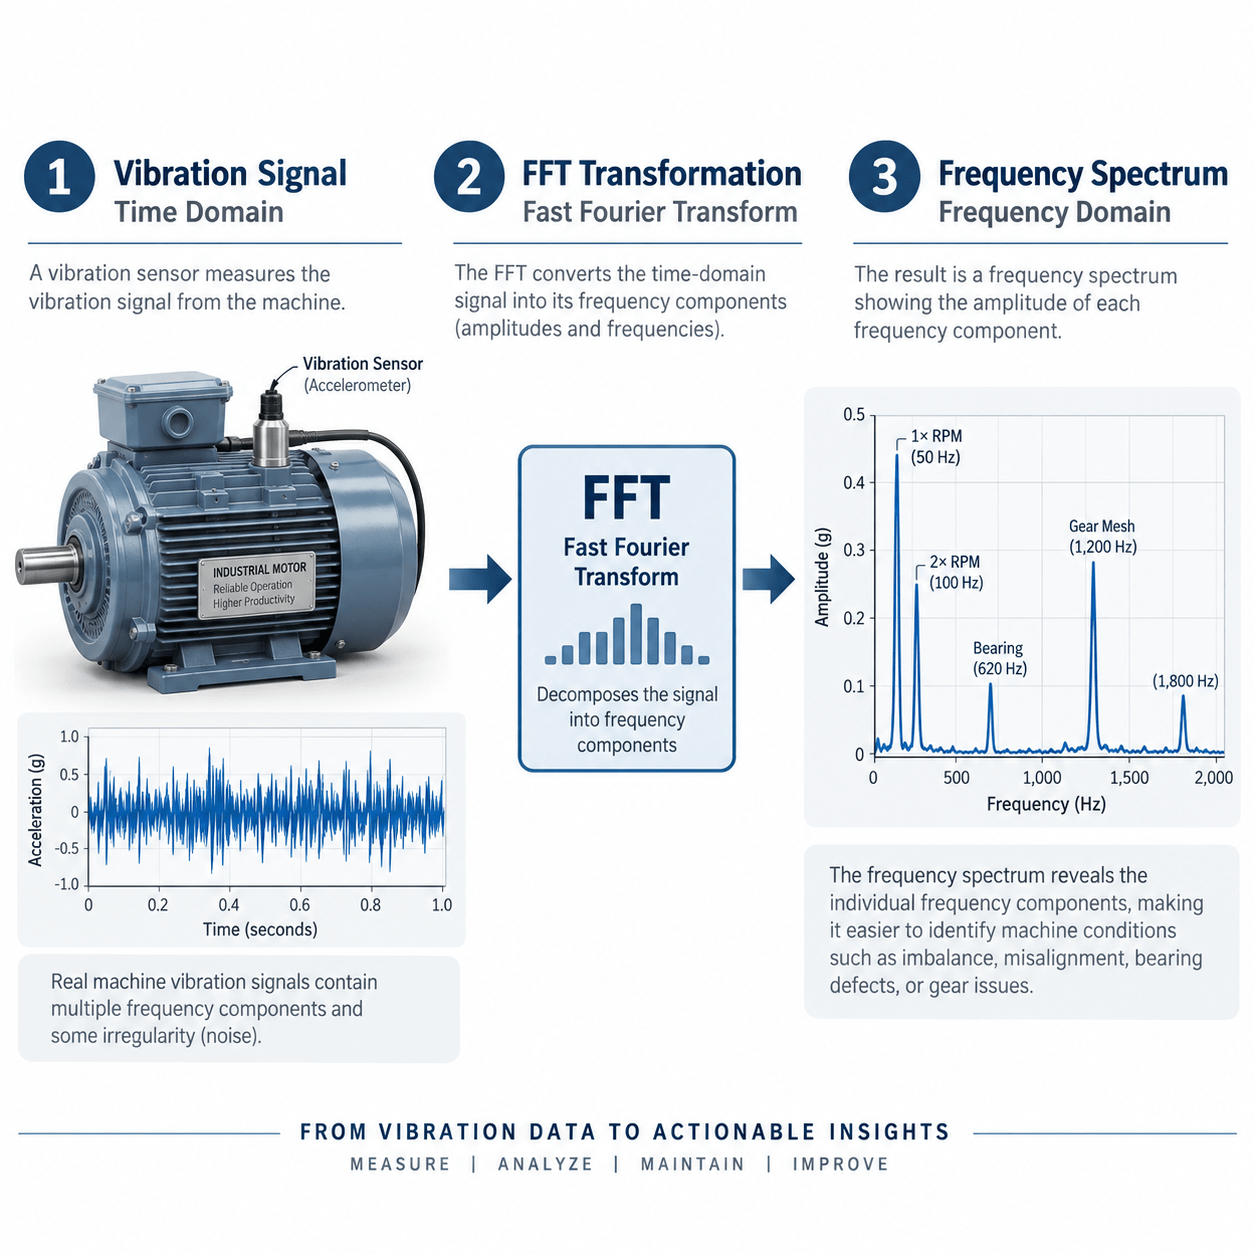
FFT stands for Fast Fourier Transform.
It is a mathematical technique that converts vibration signals from the time domain into frequency-domain information.
For example, after a vibration sensor collects data from a piece of equipment, the original signal shows:
How the equipment’s vibration changes over time
After FFT analysis, the signal can be viewed as:
Which frequencies exhibit more significant vibration
By analyzing these frequency characteristics, engineers can compare them with information such as the equipment’s rotational speed, bearings, gears, and other components. This helps identify abnormal vibration patterns and diagnose potential equipment faults.
Why Is FFT Analysis Necessary?
Suppose a motor is experiencing abnormal vibration. Simply observing an increase in vibration levels only tells us: “There may be a problem with this motor.”
Possible causes may include:
-
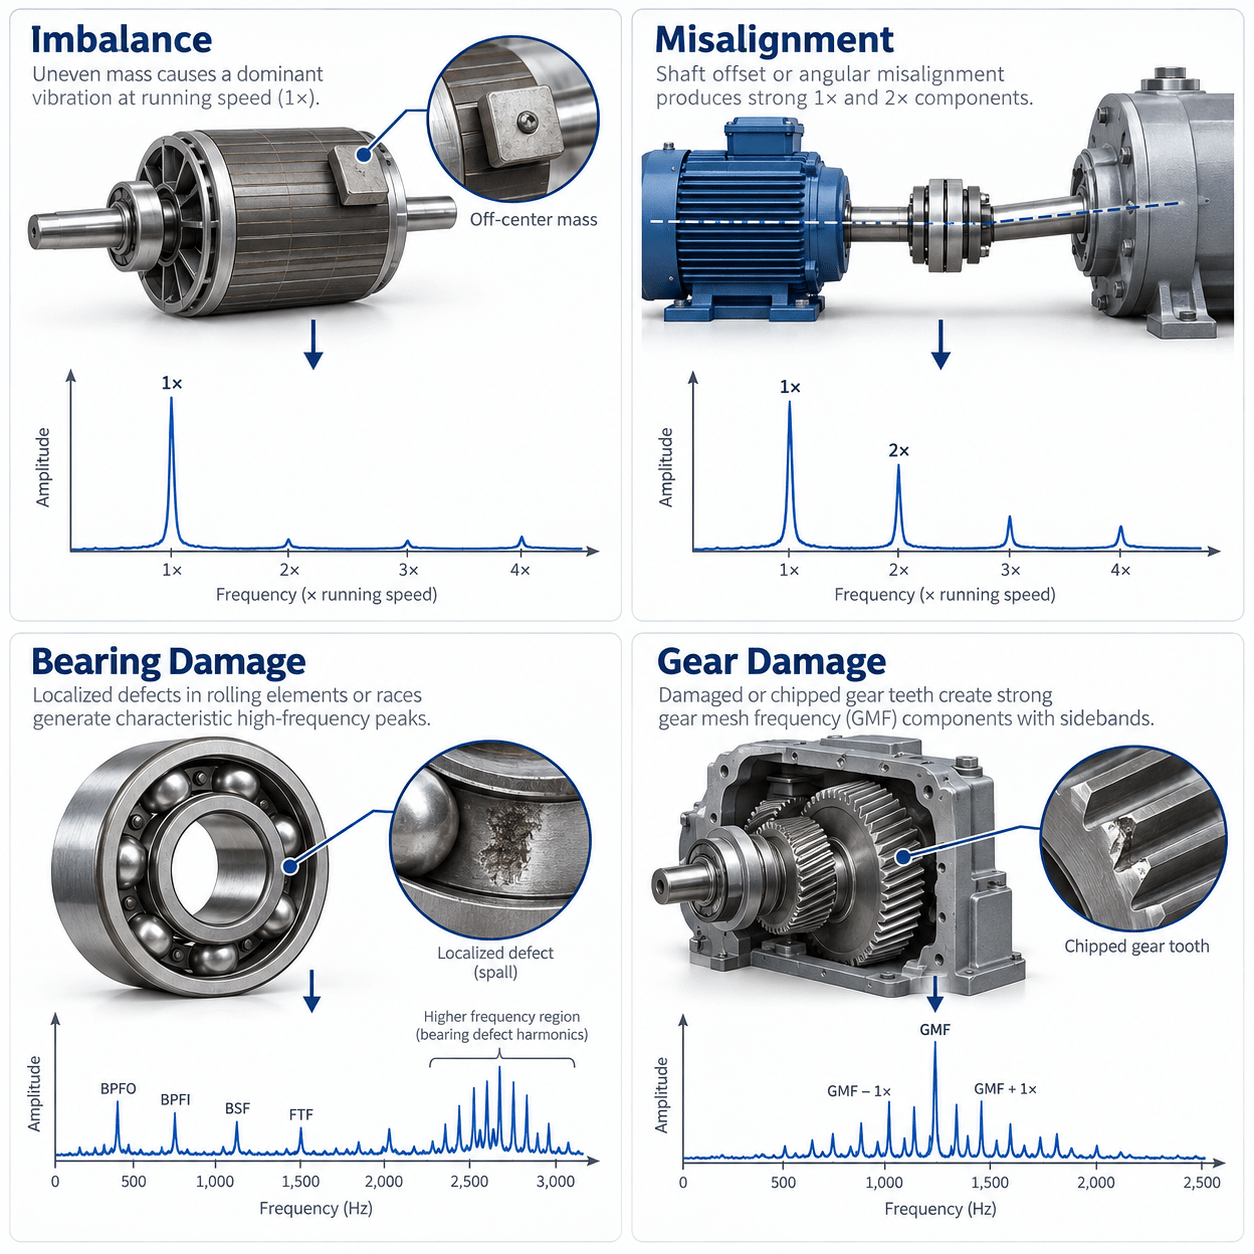
- Rotor imbalance
- Shaft misalignment
- Bearing Degradation
- Structural Looseness
- Gear Defects
The value of FFT lies in its ability to break down complex vibration signals into different frequency components, allowing us to further identify:
“At which frequencies is the equipment exhibiting abnormal vibration?”
By analyzing these frequencies against known fault signatures of the equipment, we can identify potential fault causes and support more accurate equipment fault diagnosis.
How to Read an FFT Spectrum: Understanding the Two Key Axes
Reading an FFT spectrum is not as complicated as it may seem. The key is to understand the relationship between the X-axis and Y-axis:
X-axis (Frequency, Hz): Identify Potential Fault Frequencies
Represents the frequency at which vibration occurs. The fundamental rotational frequency, or 1X, can be calculated by dividing the equipment’s rotational speed (RPM) by 60. Example: 1,800 RPM ÷ 60 = 30 Hz (1X). If a significant energy peak appears at 30 Hz, it indicates that the vibration is directly related to the shaft’s rotational frequency.
Y-axis (Amplitude): Assess Vibration Severity
Represents the vibration intensity at a given frequency. The higher the peak, the greater the vibration energy at that frequency.
However, one important point to keep in mind:
A single peak does not necessarily indicate a specific type of fault.
Accurate fault diagnosis requires the frequency spectrum to be evaluated together with the equipment’s rotational speed, measurement location, machine structure, and other vibration characteristics.
Is Vibration Data Enough for Fault Diagnosis?
Not necessarily.
This is one of the most important concepts in equipment vibration analysis.
Today, collecting vibration data from equipment is relatively easy. However:
Having data ≠ Having diagnostic capability.
For example:
“The equipment’s vibration level has increased.”
This only tells us that the equipment may be experiencing an abnormal condition.
The real question is:
“Why has the vibration increased?”
Answering this question requires further analysis of the vibration signals and their associated fault characteristics.
From Vibration Monitoring to Intelligent Fault Diagnosis
For industrial equipment, the real value lies not simply in collecting more data, but in turning that data into actionable insights about equipment condition.
FFT spectrum analysis can identify frequency characteristics from complex vibration signals. When combined with fault databases and intelligent analytics, it can further support equipment fault diagnosis.
As a result, equipment health management can move beyond simply asking: “Is there an abnormality?” to: “What type of fault could be causing it?” and ultimately help maintenance personnel determine: “What should we inspect first?”
This represents an important step in the evolution of vibration monitoring—from simple data collection to intelligent fault diagnosis.

FFT Spectrum Analysis is an essential tool for vibration analysis and equipment fault diagnosis.
By converting vibration signals into frequency-domain information, FFT spectrum analysis allows us to observe vibration patterns such as rotational frequencies, bearing fault frequencies, and gear mesh frequencies, helping identify potential abnormalities in industrial equipment.
However, true fault diagnosis is not simply about “looking at an FFT spectrum.”
Vibration signals + spectrum analysis + equipment information + extensive fault cases are what enable equipment data to be transformed into meaningful and actionable diagnostic insights.
Through vibration monitoring and an extensive equipment fault database, Prognosis Technology helps businesses move from detecting abnormalities and analyzing vibration characteristics to identifying potential equipment faults, enabling a more proactive approach to equipment maintenance rather than simply waiting for failures to occur.
From monitoring vibration to truly understanding your equipment.